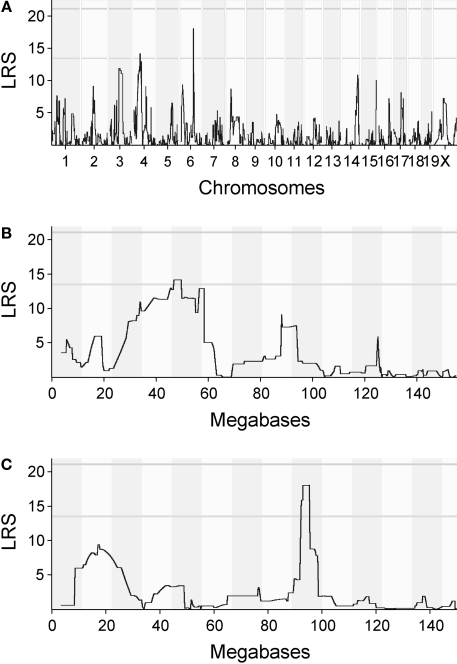
Figure 4.
QTL maps for initial magazine checking behavior. (A) Quantitative trait loci (QTL) map for initial magazine checking behavior. QTL map for initial magazine checking behavior presents likelihood ratio statistics for the trait over the whole genome. Numbers on the x-axis represent chromosomes. Suggestive and conservative significance thresholds are marked by gray horizontal lines. The likelihood ratio statistic (LRS) score reaches the suggestive threshold on chromosomes 4 and 6. (B) QTL map for initial magazine checking behavior, zoomed in on chromosome 4. LRS for the chromosome 4 reaches its peak around 47–48 megabases (MB). The abscissa runs from 0 to 155 megabases. (C) QTL map for the same trait, zoomed in on chromosome 6. LRS reaches the threshold for suggestive QTL around 93–95 MB. The abscissa runs from 0 to 145 megabases.

