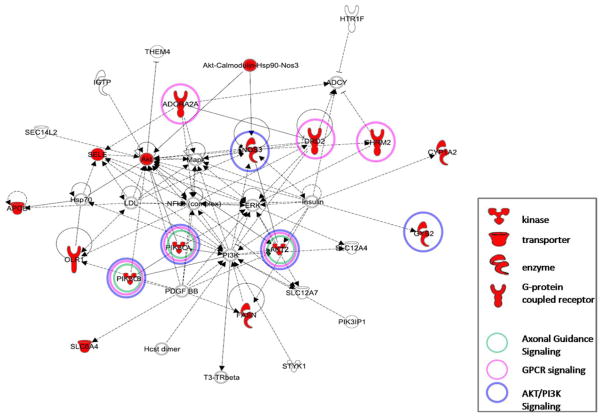
Figure 3.
Functional network identified by genes in the single nucleotide polymorphism (SNP) component using independent component analysis. Nodes in the red represent genes in the SNP component. The other molecules found in the network are possible connections and interactions between molecules, based onIngenuity Pathway Analysis knowledge base. Axonal Guidance signaling, G-protein-coupled receptor (GPCR) signaling, and PI3K/AKT signaling were the main signaling networks found. The genes with the colored circles in the network diagram are relevantly expressed in their respective pathways. The shapes of each gene symbol in the network denote the class of that gene as defined by the Ingenuity Pathway Analysis tool.

