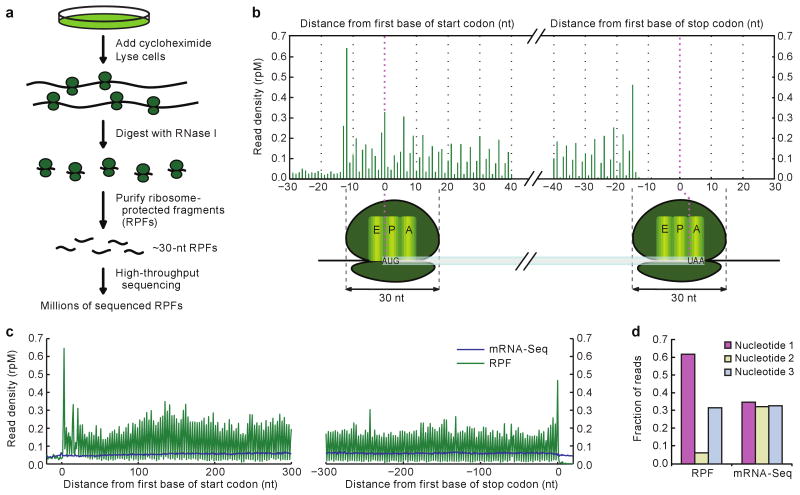
Figure 1. Ribosome profiling in human cells captured features of translation.
a, Schematic diagram of ribosome profiling. Sequencing reproducibility and evidence for mapping to the correct mRNA isoforms are illustrated (Supplementary Fig. 1a, b). b, RPF density near the ends of ORFs, combining data from all quantified genes. Plotted are RPF 5′ termini, as reads per million reads mapping to genes (rpM). Illustrated below the graph are the inferred ribosome positions corresponding to peak RPF densities, at which the start codon was in the P site (left) and the stop codon was in the A site (right). The offset between the 5′ terminus of an RPF and the first nucleotide in the human ribosome A site was typically 15 nucleotides (nt). c, Density of RPFs and mRNA-Seq tags near the ends of ORFs in HeLa cells. RPF density is plotted as in panel b, except positions are shifted +15 nucleotides to reflect the position of the first nucleotide in the ribosome A site. Composite data are shown for ≥600-nucleotide ORFs that passed our threshold for quantification (≥100 RPFs and ≥100 mRNA-Seq tags). d, Fraction of RPFs and mRNA-Seq tags mapping to each of the three codon nucleotides in panel c.

