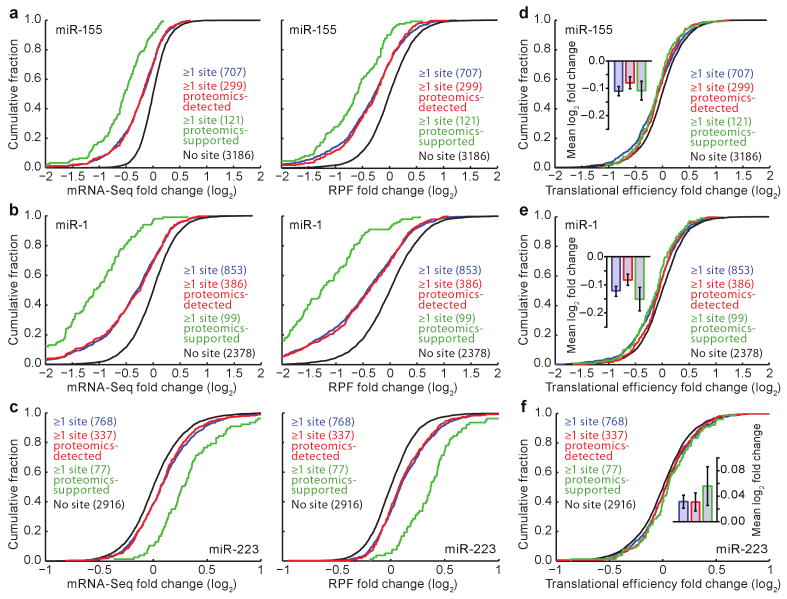
Figure 2. MicroRNAs downregulated gene expression mostly through mRNA destabilization, with a small effect on translational efficiency.
a, Cumulative distributions of mRNA-Seq changes (left) and RPF changes (right) after introducing miR-155. Plotted are distributions for the genes with ≥1 miR-155 3′UTR site (blue), the subset of these genes detected in the pSILAC experiment (proteomics-detected, red), the subset of the proteomics-detected genes with proteins responding with log2-fold change ≤ −0.3 (proteomics-supported, green), and the control genes, which lacked miR-155 sites throughout their mRNAs (no site, black). The number of genes in each category is indicated in parentheses. b, Cumulative distributions of mRNA-Seq changes (left) and RPF changes (right) after introducing miR-1. Otherwise, as in panel a. c, Cumulative distributions of mRNA-Seq changes (left) and RPF changes (right) after deleting mir-223. Otherwise, as in panel a, with proteomics-supported genes referring to genes with proteins that responded with log2-fold change ≥ 0.3 in the SILAC experiment. d, Cumulative distributions of translational efficiency changes for the polyadenylated mRNA that remained after introducing miR-155. For each gene, the translational efficiency change was calculated by normalizing the RPF change by the mRNA-Seq change. For each distribution, the mean log2-fold change (± standard error) is shown (inset). e, Cumulative distributions of translational efficiency changes for the polyadenylated mRNA that remained after introducing miR-1. Otherwise, as in panel d. f, Cumulative distributions of translational efficiency changes for the polyadenylated mRNA that remained after deleting mir-223. Otherwise, as in panel d.

