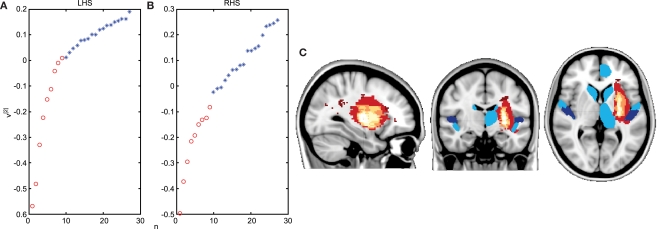
Figure 3.
Network analysis detects changes in contralesional structural connectivity following stroke. (A,B) Results of reordering of participants using structural connectivity data. Chronic stroke patients are indicated by red circles and age-matched healthy controls by blue stars. Ordering of participants is achieved using spectral reordering and is based on the right singular vector, v[2], which is plotted on the y-axis (see Crofts et al., 2010 for details). Individuals are ordered along the x-axis based on increasing values of [v]2. Clear separation between patients and controls is apparent when using communicability information from both the lesioned (A) and the contralesional hemisphere (B). (C) Areas driving the separation between patients and controls are shown in blue. These regions have significantly lower communicability in patients compared to controls. They tend to be clustered around the lesion location (overlap map of lesions is shown in red to yellow). Based on data presented in Crofts et al. (2010).

