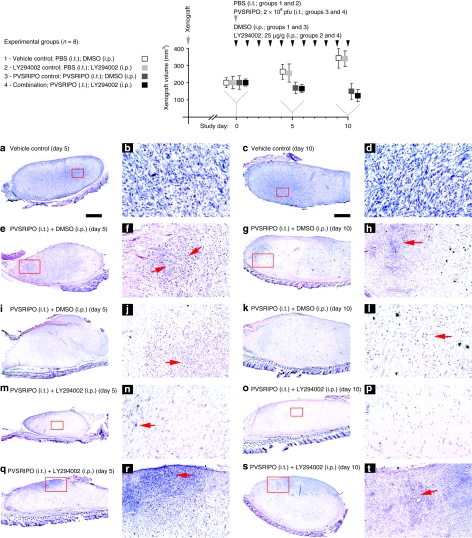
Figure 2.
Testing PVSRIPO and PI3K inhibitor synergy in vivo. Experimental groups and the study regimen are indicated atop. U-118 xenografts were measured at study days 0 (when PVSRIPO/vehicle and LY294002/vehicle treatment was initiated), 5, and 10. Four animals of each group were euthanized at study days 5 and 10 for histology and virus recovery. The bottom panels show histology from xenografts recovered at day 5 (left columns) and 10 (right columns). Tumors from one animal in group 1 at (a,b) day 5 and (c,d) day 10, two animals in group 3 at (e,f,i,j) day 5 and (g,h,k,l) day 10 and two animals in group 4 at (m,n,q,r) day 5 and (o,p,s,t) day 10 were analyzed. Low-magnification images in the left columns are accompanied by higher magnification images from the same section (red inserts) in the column to their right. (a–d) Tumor histology of a representative xenograft from group 1 shows the characteristic dense arrangement of tumor cells. (e–l) Histology of two representative tumors from group 3 at study days 5 and 10 as indicated. Note extensive tumor cell loss and “empty” appearance of the former xenograft in all cases. Red arrows point to areas of intense tumor-cell killing and active tissue rearrangement. (m–t) Histology of four representative tumors from group 4 at study days 5 and 10 as indicated. (m,n,o,p) show almost complete tumor regress at study days 5 and 10. (n,p) The area of the former tumor was invaded by cells with fibroblast morphology surrounded by dense extracellular matrix. Isolated viable tumor cells (n; arrow) may remain. (q,r) Active tumor (red arrow), which was still present in three animals of group 4 at day 5 and two animals at (s,t) day 10. DMSO, dimethyl sulfoxide; i.p., intraperitoneal; i.t., intratumoral; PBS, phosphate-buffered saline.

