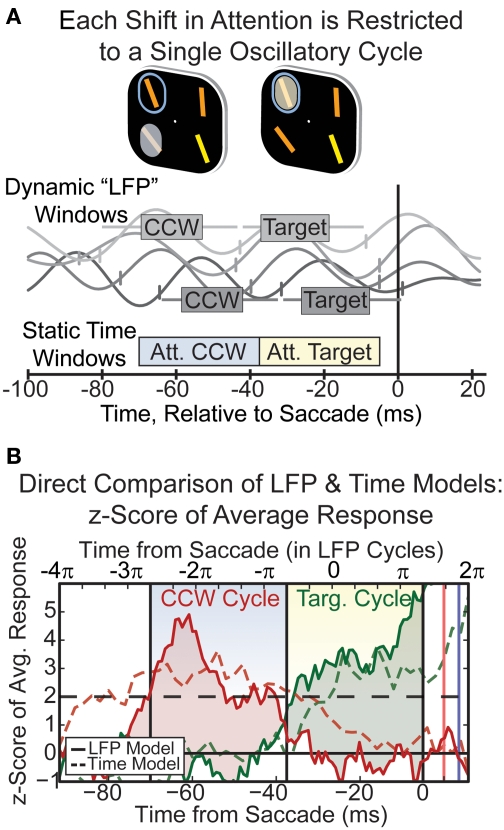
Figure 4.
(A) Diagram outlining how the shifting spotlight of attention is encapsulated by ongoing oscillations in the 18–34 Hz band. Circled object is the target, highlighted item is the currently attended location. Cycles of LFP oscillation were used to define periods of time when attention was at the CCW or Target location for each trial (show in gray boxes). This was compared to traditional static, time-based windows (shown along bottom). (B) Neural response to directing attention into a cell's preferred location, which can either be counter-clockwise (CCW) to the target location (red, second row of Figure 2) or at the target location (green, top row of Figure 2). The difference in response (shaded regions) reflects the information about the locus of attention. Information is greater when using the “dynamic” time windows defined by LFP oscillations (solid lines) compared to the static time-windows (dashed lines), suggesting each shift in attention occurs in a cycle of the beta oscillation.

