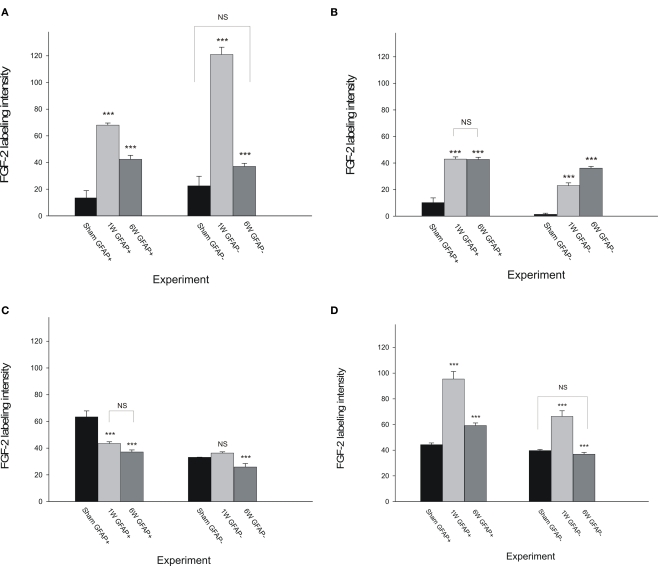
Figure 5.
Fibroblast growth factor-2 labeling intensity in GFAP-positive ad GFAP-negative cells compared to sham-operated cases in the four examined regions of the CNS. The graph shows an evident colocalization between FGF-2 and GFAP in lesioned animals brainstem (A) and spinal cord (SC1: B and SC3: D) during the whole experimental period except in SC2 (the part of the spinal cord above the lesion site: C). Pattern of distribution of FGF-2 secreting cells was somehow similar in BS (A) and SC3 (D) but the sublesional part showed a much more significant colocalization. Stars are comparisons between columns and their previous ones except where noted.

