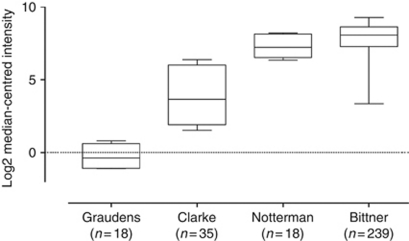
Figure 1.
GAPDH fold change in different colon adenocarcinoma studies (Graudens et al, 2006; Clarke et al, 2003; Notterman et al, 2001 and Bittner, not published (International Genomics Consortium, Expression Project for Oncology - Colon Samples, http://www.ncbi.nlm.nih.gov/geo/query/acc.cgi?acc=GSE2109)). Zero on the bar chart scale represents no change, with each increment on the scale representing a two-fold difference. In Bittner study, it means that the observed 5.922 interval between maximal and minimal values corresponds to a 25.922, i.e., 60 GAPDH fold change.

