Figure 1.
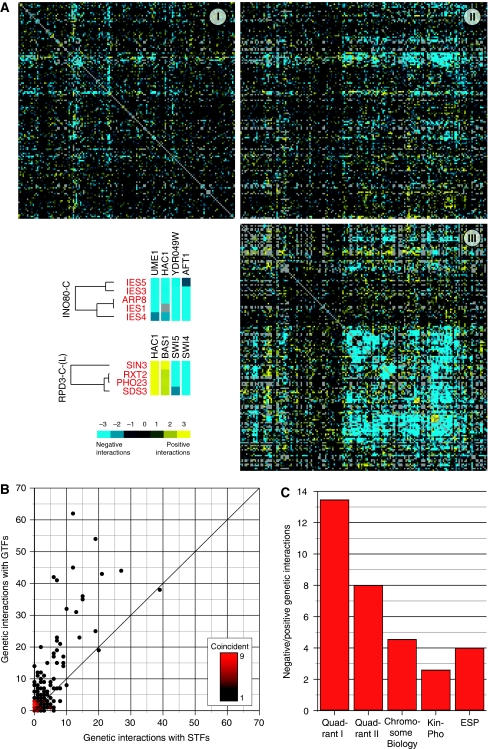
Site-specific and general transcription factors evoke distinct patterns of epistasis. (A) Genes were segregated into site-specific (STF) or general (GTF) transcription factor classes and clustered based on their quantitative epistatic interaction profiles. Quadrants I, II, and III represent the STF–STF, STF–GTF, and GTF–GTF classes, respectively. The intensity of yellow and blue indicates the strength of positive and negative interactions, respectively. Individual interactions between components of the INO80-C and RPD3-C-(L) chromatin remodeling complexes and selected STFs are shown (bottom left). (B) A density plot shows a preference for STFs to display significant genetic interactions with GTFs compared with other STFs. Each point on the plot represents a single STF or groups of STFs with identical interaction frequency. (C) The ratio of negative (S-score⩽−2.5) to positive interactions (S-score ⩾2.5) for the set of genes in quadrant I is significantly greater (P=0.0068) than that for quadrant II and even more significant when compared with the data from E-MAPs focusing on the early secretory pathway (ESP) (Schuldiner et al, 2005) (P<10−10), chromosome biology (Collins et al, 2007) (P<10−8), and signaling (Fiedler et al, 2009) (P<10−20).

