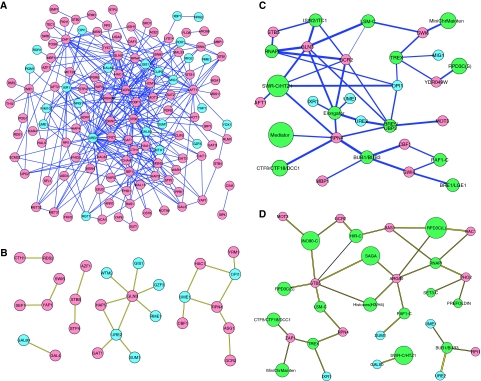
Figure 2.
Network representation of genetic interactions between and among STFs and GTFs. STFs linked to each other by negative (A) or positive (B) interactions, and to GTF complexes by negative (C) or positive (D) interactions are shown. Red, blue, and green shading indicate activating and repressing gene products, or GTF protein complexes, respectively. The sizes of the green nodes corresponding to the GTFs correlate with the number of components of the complex that were genetically analyzed. The thickness of the line corresponds to the strength of the interaction. See http://interactome-cmp.ucsf.edu for a list of all interactions. Source data is available for this figure at www.nature.com/msb.

