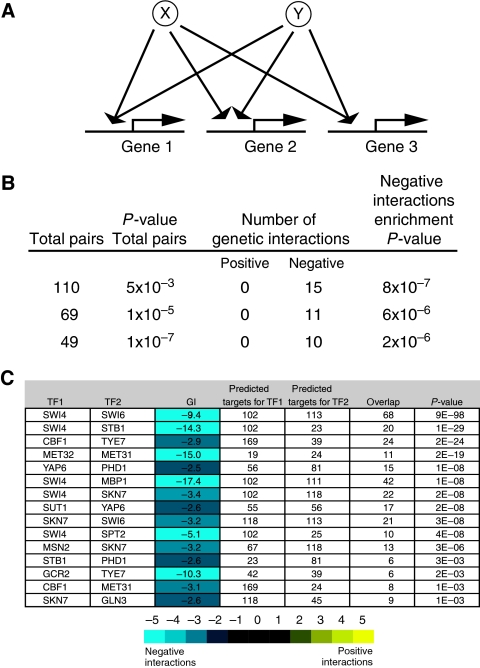
Figure 4.
STFs that regulate similar sets of genes display negative genetic interactions. The number of occurrences of such architectures (A) are tabulated (B), and specific examples indicated (C). (B) Using previously reported target predictions (MacIsaac et al, 2006) from ChIP-chip data (Harbison et al, 2004), three different P-value thresholds (0.005, 10−5, and 10−7) (based on significant target overlap) were applied for each pair of transcription factors. The number of significantly negative (⩽−2.5) and positive (⩾2.5) genetic interactions, as well as the statistical enrichment for negative interactions, is listed for each set. (C) The 15 pairs of STFs that shared a significant overlap of target genes (0.005) and displayed negative genetic interactions are tabulated.

