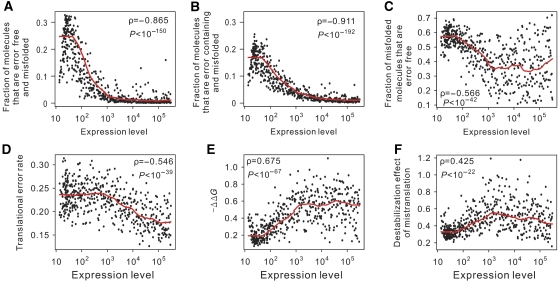
Figure 3.
Amount of error-free and error-induced protein misfolding found in computer simulations when both sources of misfolding are considered. The probabilities of error-free misfolding (A) and error-induced misfolding (B) and the fraction of misfolded molecules that are error-free (C) all decrease with the rise of the gene expression level. (D) The rate of translational error per protein decreases as the gene expression level increases. (E) The destabilizing effect (−ΔΔG) per translational error increases with gene expression level. (F) The total destabilization effect of mistranslation increases with gene expression level. Correlation coefficients and significance levels are determined by Spearman's rank correlation tests. The red lines are estimated using locally weighted scatterplot smoothing.

