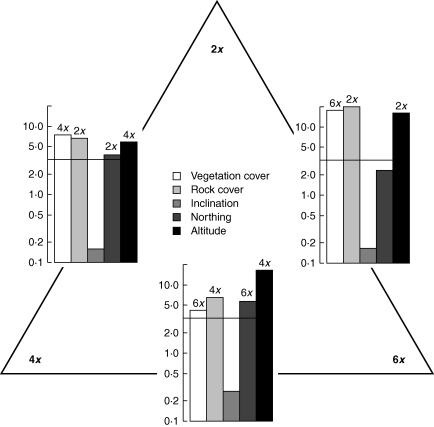
Fig. 2.
Pairwise comparisons of five environmental descriptors among the three main cytotypes of Senecio carniolicus. Bars represent the absolute value of the t-statistic derived from linear mixed-effects models as a measure of the difference between the cytotypes. Black lines correspond to a significance level of P = 0·001. Above the bars the cytotype with the significantly greater values of the descriptor is given.

