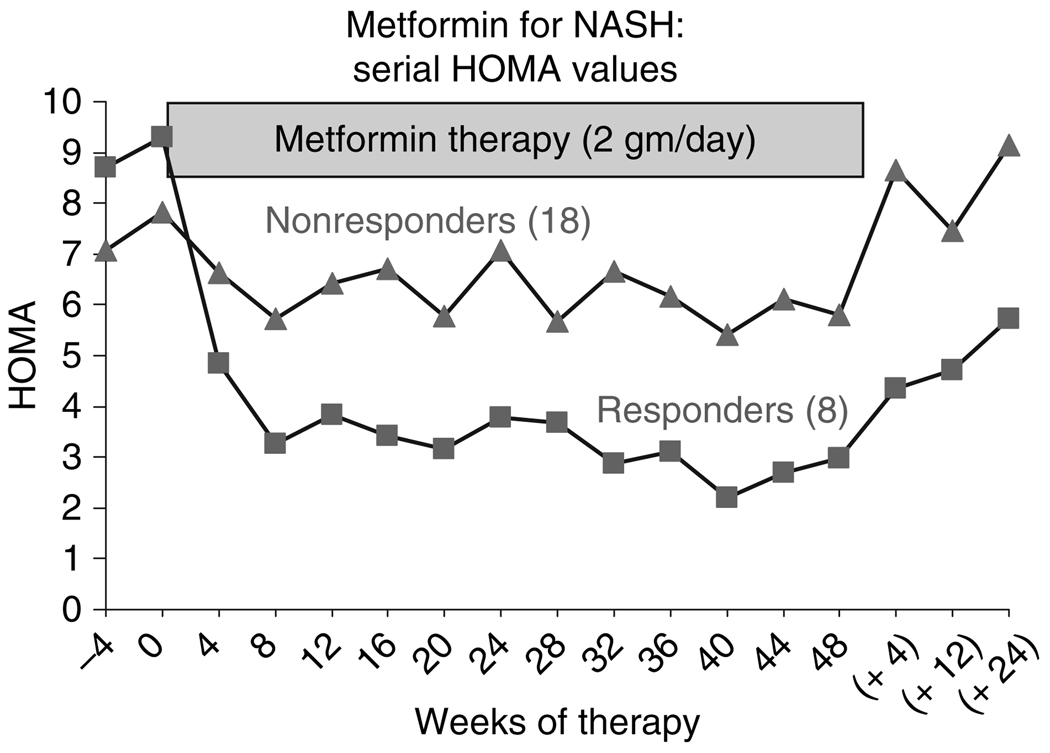
Figure 4.
Changes in average homeostasis model assessment (HOMA) values in eight responders and 18 nonresponders to a 48-week course of metformin. The diamonds represent the mean HOMA values of the eight responders and the squares, those of the 18 nonresponders during therapy and then again when measured 4, 12 and 24 weeks later (in eight responders, only one remaining on metformin and 16 nonresponders, four remaining on metformin).

