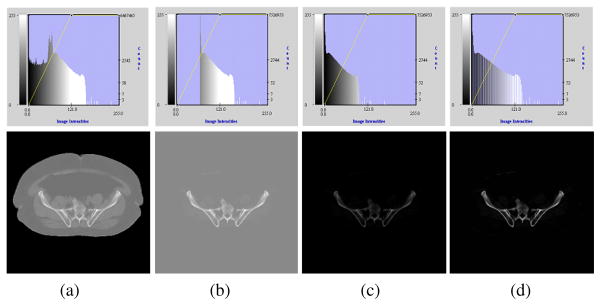
Fig. 6.
Demonstration of the preprocessing step performed on the patient’s CT data to make it more comparable with the atlas density image. The top row shows intensity histograms corresponding to the figures in the bottom row. (a) Original image. (b) Intensities below bone CT densities set to typical soft tissue values. (c) Intensities shifted such that the background is set to zero. (d) Intensities normalized.

