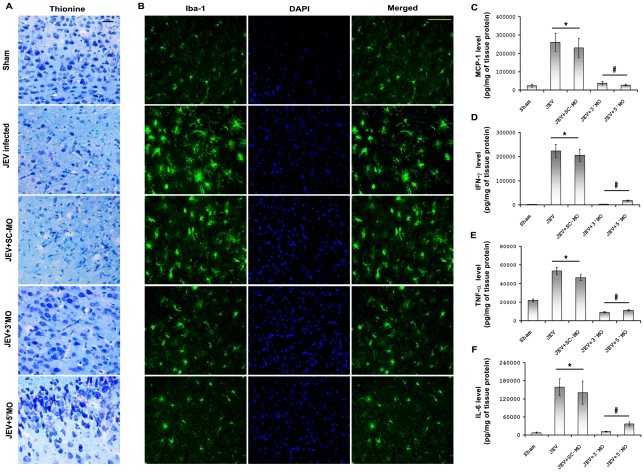
Figure 4. MOs neuroprotect, reduces microglial activation and inhibits proinflammatory cytokines production in brain.
Thionin staining of brain sections from all the treatment groups showed neurons with distinct morphology in Sham-treated, JEV+3′ MO and JEV+5′ MO groups. However in sections from JEV-infected and JEV+SC-MO groups showed damaged neurons with altered morphology. Magnification ×20; scale bar correspond to 50 µ. Immunofluorescent staining for microglia-specific Iba-1 performed in brain sections of all groups showed that number of activated (star shaped) microglia appeared to be more frequent in JEV-infected and JEV+SC-MO groups as compared to compared to sections belonging to Sham, JEV+3′ MO and JEV+5′ MO groups. Magnification ×20; scale bar correspond to 50 µ (B). Photomicrographs shown here in this figure are representative of three individual animals from each group. CBA showed levels of MCP-1, IFN-γ, TNF-α, and IL-6 were increased significantly in both JEV-infected and JEV+SC-MO groups when compared to Sham treated groups. The elevated levels of these proinflammatory cytokines were then significantly reduced with 3′ and 5′ MO treatments (* p<0.01 for JEV and JEV+SC-MO when compared to Sham; # p<0.01 for JEV+ 3′MO and JEV+ 5′ MO when compared to only JEV-infected group) (C–F).

