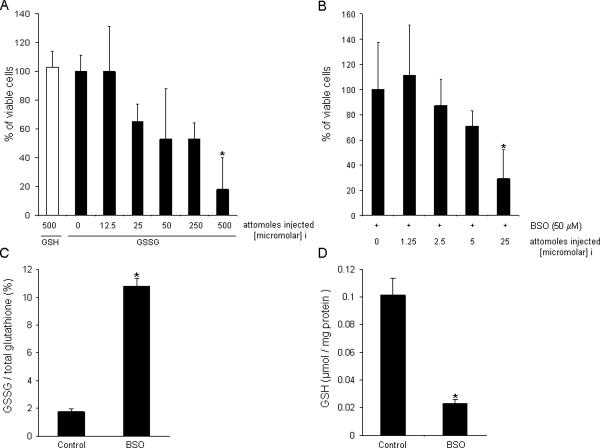
Figure 2. Dose dependent GSSG toxicity.
A, 500 attomole GSH or GSSG (0, 12.5, 25, 50, 250, and 500 attomoles) was microinjected into the cytoplasm of HT4 cells for 24h. B, GSSG (0, 1.25, 2.5, 5 and 25 attomoles) was injected into the cytoplasm of HT4 cells pre-treated with 50 μM BSO for 12h. Cellular GSSG/total glutathione (C) was increased, and absolute value of GSH (μmol/ mg protein) was decreased after 50 μM BSO treatment (D). attomoles injected [micromolar]i, n=3, Results are mean ± S.D. *, p < 0.05.

