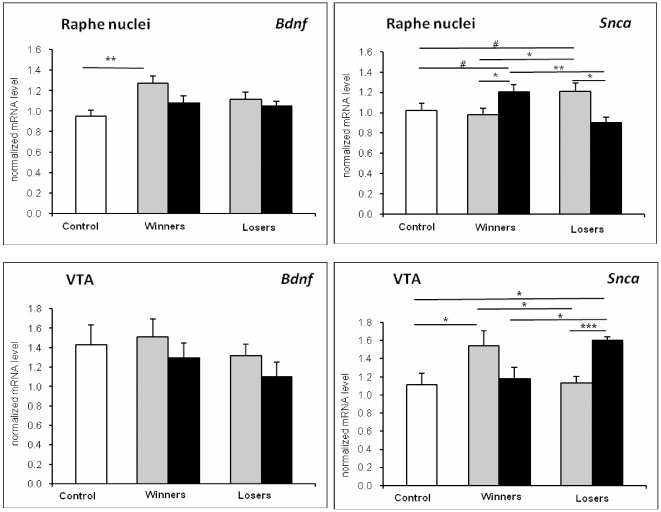
Figure 1. The normalized Snca and Bdnf mRNA levels in the VTA and raphe nuclei of midbrain of the controls (white columns), 20-time winners and 20-time losers (grey columns) and no-fighting winners and no-fighting losers (black columns).
* p<0.05; ** p<0.01; *** p<0.001; # - 0.05<p<0.1 comparisons between respective groups.

