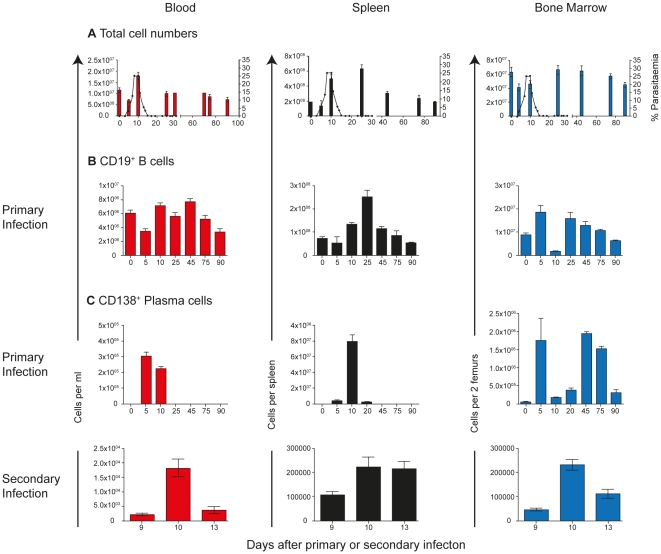
Figure 1. Changes in B-cell and plasma-cell number in different compartments.
C57BL/6 mice were injected intraperitoneally with 105 Plasmodium chabaudi chabaudi (AS) iRBC and the infection course followed. A) Total PBMC in peripheral blood (red), spleen (black) and bone marrow (two femurs; blue) at different time points following a primary infection; B) CD19+ B cells determined by flow cytometry following a primary infection; C) Numbers of CD138+ plasma cells/plasmablasts determined by flow cytometry following a primary (upper panel) and secondary infection (lower panel). Gating strategies for CD19+ and CD138+ cells are shown in Figure S1. The values and error bars shown are the means and the standard errors of the mean (SEM) of 5 to 7 mice.

