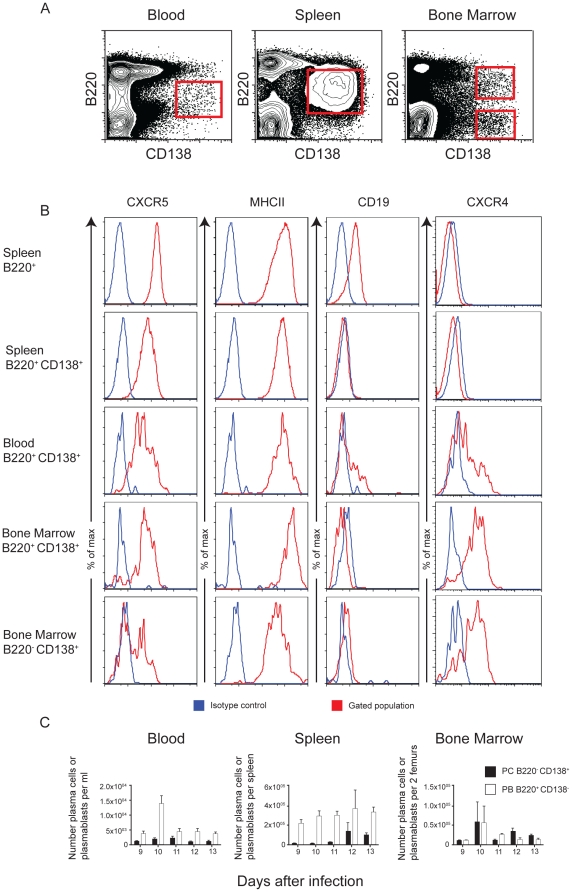
Figure 6. Antibody-secreting cells in peripheral blood are migrating plasmablasts.
A) Gating strategy for the identification of plasmablasts and long-lived plasma cells (LLPC) in peripheral blood, spleen and bone marrow on day 10 of infection. B) Histograms showing relative expression of CXCR4, CD19, MHC class II and CXCR5, on spleen (top two panels), blood (middle panel) and bone marrow (bottom two panels). Differences between plasma cells and plasmablasts were determined by the mean fluorescence intensity of these markers on the gated populations (red histograms) showing the gradual acquisition of CXCR4 and loss of CXCR5, CD19, MHC class II on splenic B220+ cells (top panel), B220+ CD138+ cells in spleen, blood and bone marrow (middle three panels) and B220− CD138+ LLPC in bone marrow (bottom panel). The blue histograms represent the fluorescence profile with the isotype control antibodies. C) A representative experiment out of 3 experiments showing kinetics of the appearance of plasma cells and plasmablasts during peak of infection based on their expression of B220 and CD138. The values and error bars shown are the means and the standard errors of the mean (SEM) of 5 mice.

