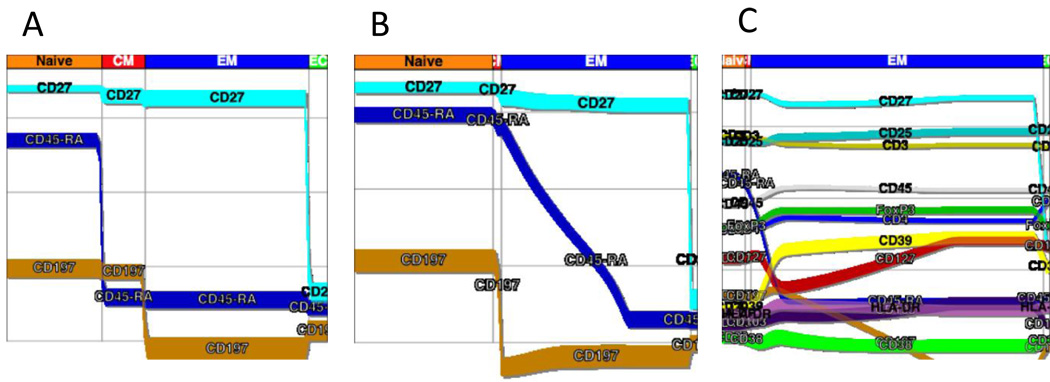
Figure 11. Probability State Modeling (PSM).
A probability state model was constructed with Gemstone Verity Software House and was applied to CD4 T cells and CD8 T cells. For these displays, the data were gated on light scatter, viability, and expression of CD45, CD3, and either CD4 or CD8 as described earlier. The y-axis is fluorescence intensity while the x-axis displays transitions from naïve to memory and effector populations. Here it is possible to visualize relative intensity of marker expression along with putative transitions among these populations.
A. The graph reveals the proportions of memory and naïve subsets as in the previous figure 2A, for CD4+ T cells.
B. The graph reveals the proportions of memory and naïve subsets as in the previous figure 2A, for CD8+ T cells.
C. For this model, the data were gated on light scatter, viability, and expression of CD45, CD3, CD4, CD25high, and FoxP3 as described earlier. The y-axis is fluorescence intensity while the x-axis displays transitions from naïve to memory and effector populations. This graphs reveals the coordinate expression patterns of memory and naïve markers as well as activation markers through the transitions.

