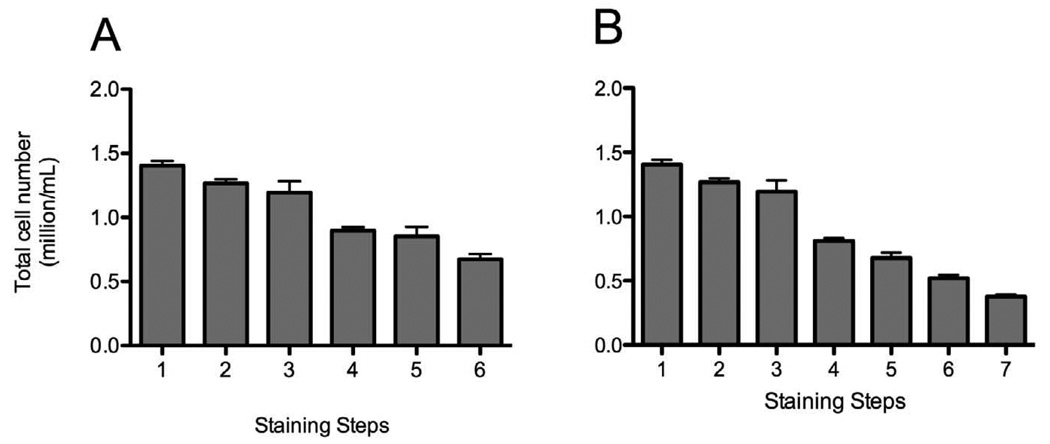
Figure 7. Cell loss during staining procedure.
Single-cell suspensions from healthy donors were stained with Treg (A) and Th17 (B), and we counted cell numbers at each steps of the staining prior to the centrifugation. The graphs represent the total cell number at each step of the staining procedure.
A. 1: wash after ACK lysis, 2: wash after ACK lysis, 3:wash after viability staining, 4:wash after extracellular staining, 5: wash after fix and permeabilization, 6: wash after intracellular staining.
B. 1: wash after ACK lysis, 2: wash after ACK lysis, 3:wash after viability staining, 4:wash after extracellular staining, 5: wash after fix and permeabilization, 6: wash after intracellular staining, 7:wash after streptavidin binding.

