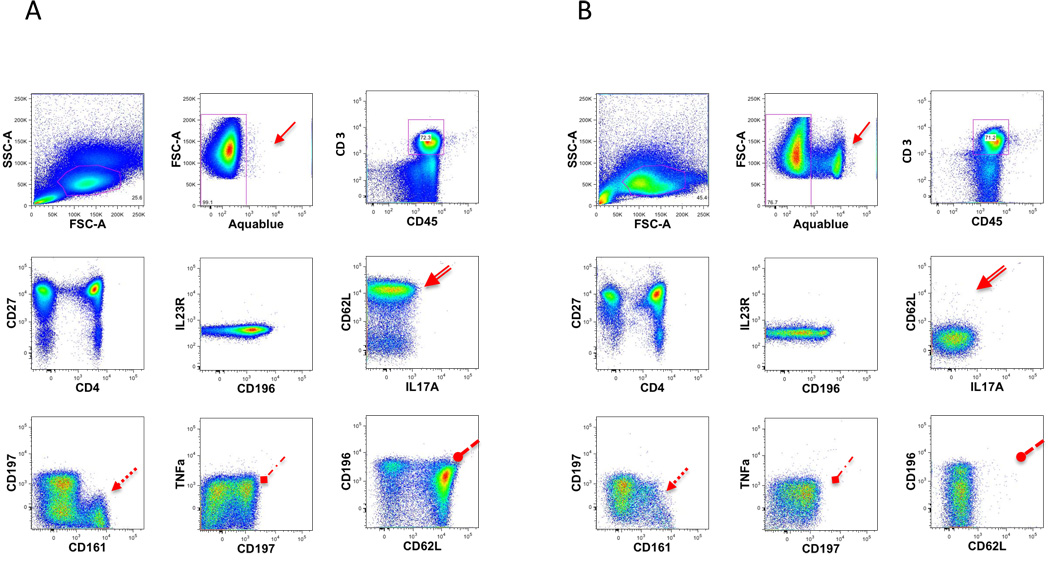
Figure 8. Fresh vs Frozen.
Freshly isolated single-cell suspensions from healthy donors or frozen cells from the same donor were stained with T2 staining. A comparison was made between the percentages of cells expressing the cell surface markers. Fresh lymphocytes (A) are compared to frozen lymphocytes (B). Presented are some of the dot plot combinations for the T2 staining.
The arrows point out the main differences observed.

