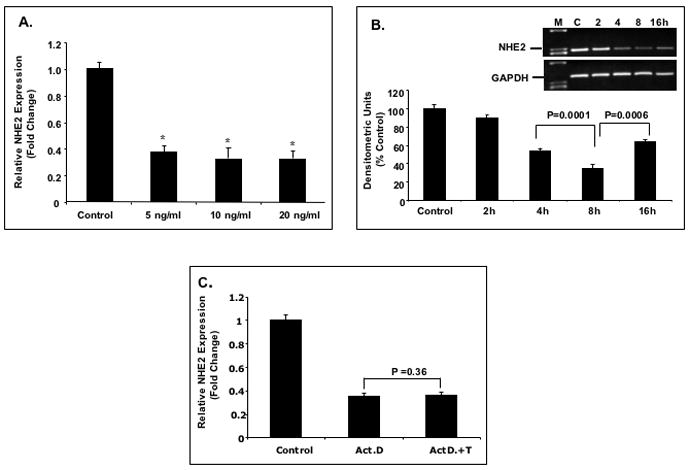
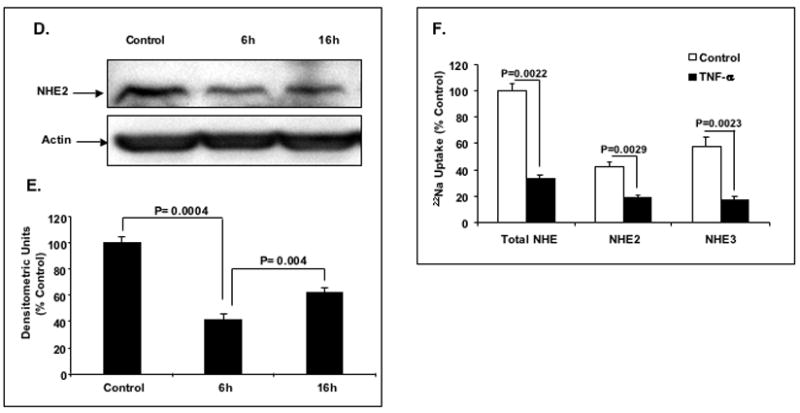
Figure 1. Effect of TNF-α on the expression and transport activity of NHE2 in C2BBe1 cells.


A: Quantitative real-time RT-PCR. Cells were serum-starved in DMEM containing 0.5% FBS for 24 h and treated with different concentrations of TNF-α for 6 h and total RNA was extracted. 5 μg of RNA from each treatment was reverse transcribed to cDNA and equal amounts of cDNA from each sample were subjected to amplification by real-time PCR. The data were normalized to GAPDH as control and changes in NHE2 expression was calculated. The NHE2 mRNA level in untreated cells was considered 100%. Values are means ± SE of three separate experiments performed in triplicates. * P< 0.05 compare to control. B: Time-course of TNF-α effect on the expression of the NHE2 mRNA. C2BBe1 cells were treated with TNF-α (10 ng/ml) for 0, 2, 4, 8, and 16 h and total RNA was extracted subjected to semi-quantitative PCR. The effects of TNF-α on the NHE2 mRNA levels at indicated time intervals were detected by gel electrophoresis (inset) and analyzed by densitometry scanning of the gels. C: Effects of actinomycin D (Act D) and TNF-α on the expression of the NHE2 mRNA in proliferating cells. C2BBe1 Cells were serum-starved in DMEM containing 0.5% FBS for 24 h and then pre-incubated with Act D (5μg/ml) for 30 min. Subsequently, TNF-α (10 ng/ml) was added and incubation continued for 8 h. Five μg of RNA from each treatment was reverse transcribed to cDNA and equal amounts of cDNA from each sample were subjected to amplification by real-time PCR. D: Whole cell lysates prepared from CeBBe1 cells treated with TNF-α for 6 and 16 h were subjected to Western blot analyses using an antibody specific for NHE2. E: Densitometric analysis of NHE2 protein levels is shown. Data are presented as intensity of the NHE2 protein relative to the actin intensity in the corresponding sample. The activity in the control was set at 100. F: TNF-α decreases the Na+/H+ exchange activity of NHE2 and NHE3. NHE activity was determined in the presence of 50 μM EIPA or 50 μM HOE-694 as described in Materials and Methods. Data are presented as percent of the control that is arbitrarily set to 100. Values are means ± SE of three separate experiments performed in triplicates. P values are indicated.
