
Fig. 3.
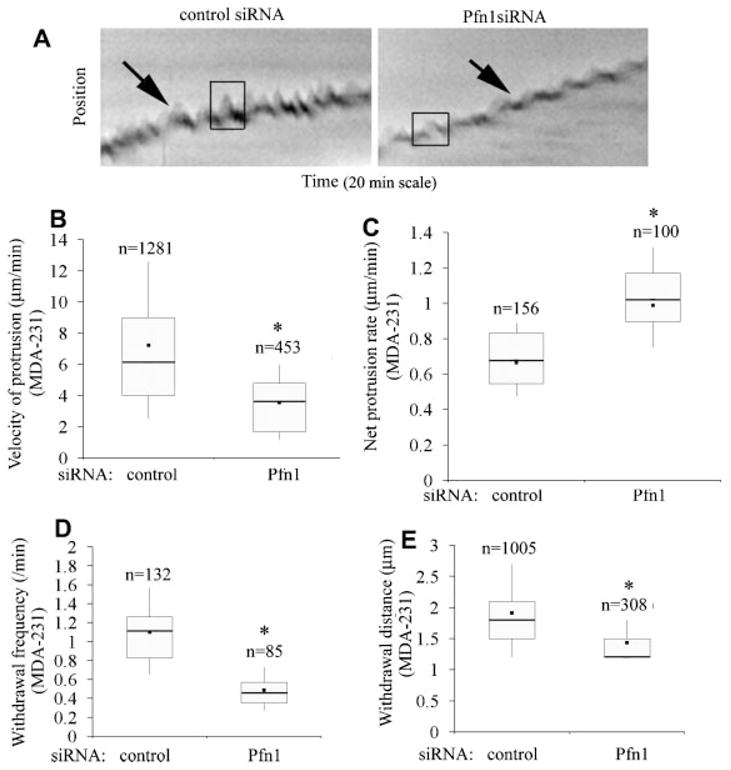
Loss of Pfn1 expression leads to slower but more stable lamellipodial protrusion in MDA-231 cells. A: Kymographs representing lamlellipodial dynamics of MDA-231 cells with or without Pfn1 depletion (leading edge traces are marked by the black arrows and the boxes outlining the saw-tooth waveforms represent typical lamellipodial protrusion and withdrawal events). B: A box and whisker plots comparing the actual protrusion velocities between control and Pfn1-siRNA treated MDA-231 cells (“n” represents the total number of protrusion events characterized by the saw-tooth waveforms).C:AboxandwhiskerplotcomparingthenetprotrusionvelocityofMDA-231cellswithorwithoutPfn1 depletion (“n” indicates the number of kymographs analyzed). D, E: Box and whisker plots comparing the frequency (part D) and average distance (part E) of lamellipodial withdrawal (i.e., the descending part of the saw-tooth wave forms) between control and Pfn1-si RNA treated MDA-231cells (“n” in parts D and E represent the total number of kymographs and with drawal events, respectively).These data are based on analyses of 30 cells for each transfection condition pooled from three independent experiments. The asterisk marks represent P < 0.05.