
Fig. 4.
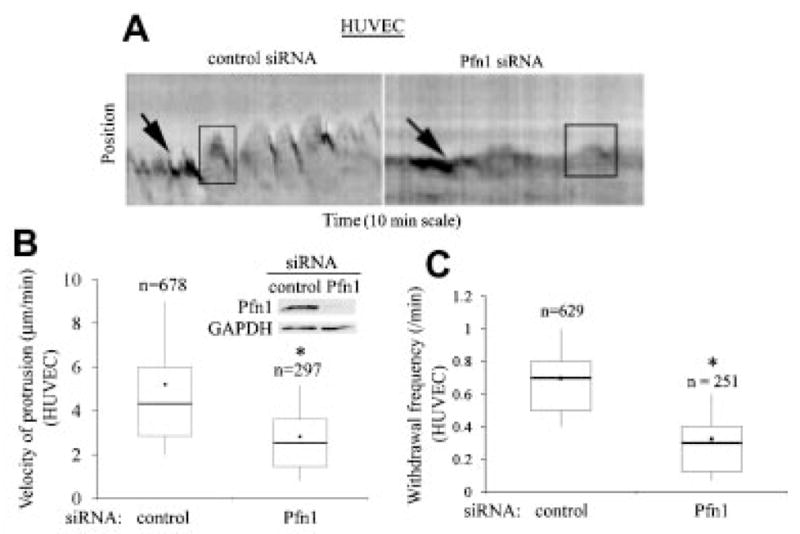
Loss of Pfn1 expression leads to slower protrusion in HUVEC cells. A: Kymographs representing lamlellipodial dynamics of HUVEC with or without Pfn1 depletion (leading edge traces are marked by the black arrows and the boxes outlining the saw-tooth waveforms represent typical lamellipodial protrusion and withdrawal events). B: A Box and whisker plot comparing the actual protrusion velocities between control and Pfn1-siRNA treated HUVEC. These data are based on analyses of 25 control and 22 Pfn1-siRNA transfected cells pooled from three independent experiments (“n” represents the total number of protrusion events analyzed in each case). The inset shows Pfn1 downregulation in HUVEC 96 h after siRNA treatment where GAPDH immunoblot serves as the loading control. C: A box and whisker plot comparing the frequency of lamellipodial withdrawal between control and Pfn1-depleted HUVEC (“n” represents the total number of kymographs analyzed in each case). The asterisk marks represent P < 0.05.