Fig. 3.
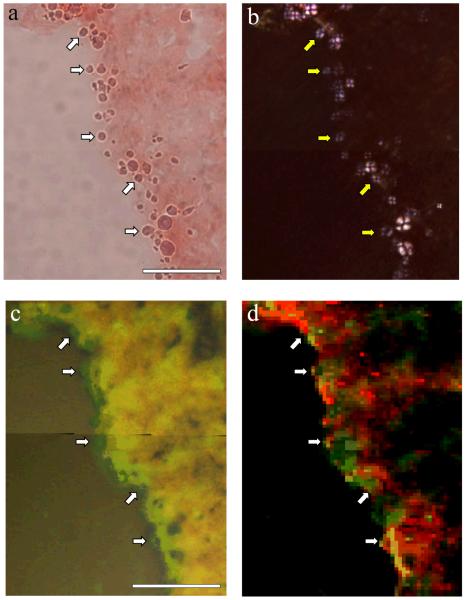
Synchrotron map of copper distribution in a spherulite-rich region of Alzheimer’s hippocampus. a, tissue region with a high population of spherulites on the edge of an internal tear between the pyramidal cell layer and the DG, shown with optical microscopy under partially crossed polarisers; b, the same region with polarising microscopy, where heavy staining of the section with Congo red produced a slight pink tint in the Maltese cross signature; c, map of copper intensity (green) for the same region, obtained with synchrotron X-ray microfocus fluorescence, overlaid on the corresponding optical image obtained at the synchrotron; d, map showing both copper intensity (green) and iron intensity (red), indicating that variations in copper intensity are not simply due to scattering effects or sample thickness. A subset of spherulites is indicated with arrows in each image to assist with registration. The scale bar is 100 μm.

