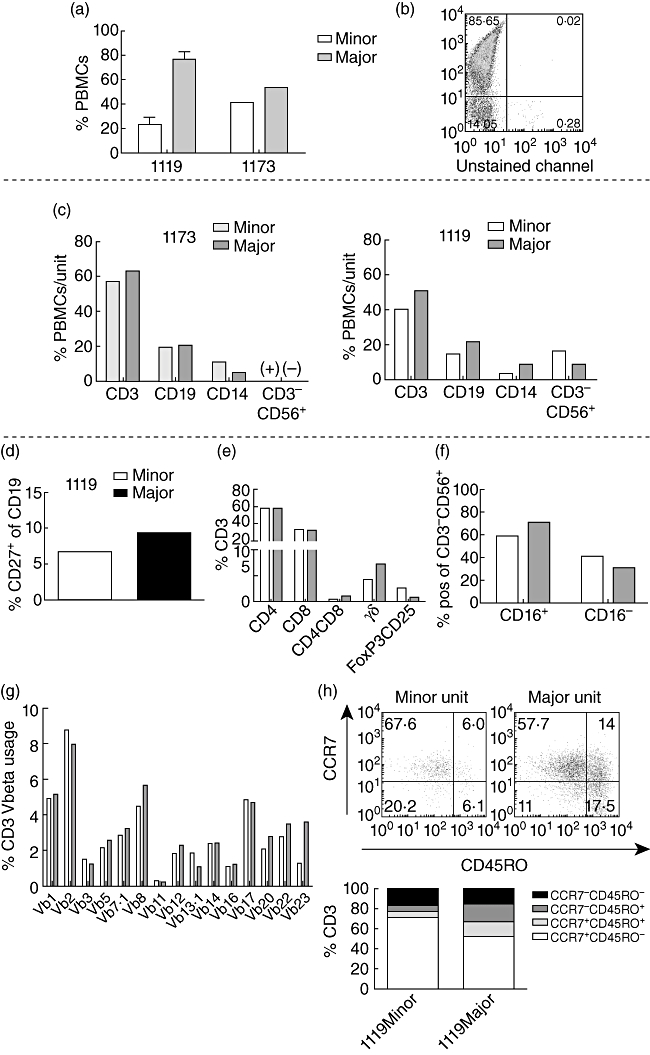
Fig. 2.

The stable donor–fonor chimerism is composed of a predominating major unit with higher frequencies of γδ- and CD4+CD8+ memory T cells, and a smaller minor unit with higher amounts of natural killer (NK) cells and more naive T cells. Analyses were performed with blood samples from months 25 to 26 (patient 1173) and 42, 43 and 55 (patient 1119) post-transplantation, respectively. (a,b) Mean % (1119) and % (1173) of peripheral blood mononuclear cells (PBMCs) from the major and minor cord blood units in both patients at the occasions of the analyses. (b) For patient 1119, flow cytometric typing assay with human leucocyte antigen (HLA)-A3 antibodies were utilized to separate the two HLA-A mismatched units. (c) An extension of the analysis in (a) for both patients. Frequencies of cell populations indicated on the x-axes are displayed as mean % (1119, n = 3) or % (1173) of PBMCs within each unit (major and minor). The CD3-CD56+ populations are shown as (+) or (−) in patient 1173 due to low signal strength. (d–h) Flow cytometric typing assay for patient 1119 only (n ≥ 2). (d) Mean % memory CD27+ cells of CD19+ B cells from each unit (major and minor). (e) Mean % of CD3+ T cell subpopulations indicated on the x-axis. (f) Mean % of CD16+/− cells within the CD3-CD56+ natural killer (NK) cell population in each unit. (g) Flow cytometry typing assay for T cell receptor (TCR) Vβ usage. Data are presented as % CD3+ cells positive for different Vβ indicated on the x-axis. (h) T cell maturation profile (from least mature to most mature: CCR7+CD45RO-; CCR7+CD45RO+; CCR7-CD45RO+; CCR7-CD45RO-) comparing the two units. Data are presented as mean % of CD3+ cells.
