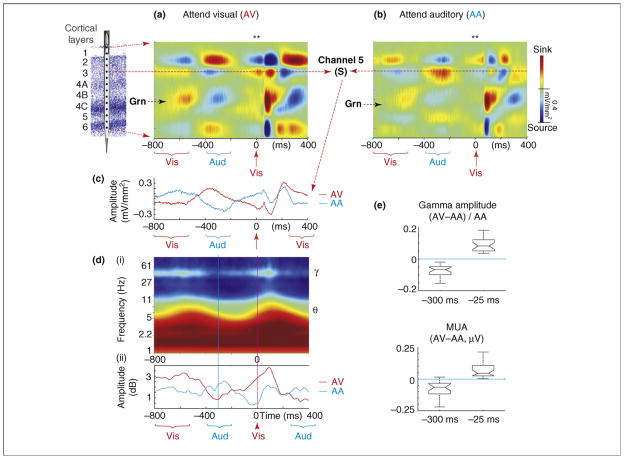
Figure 4.
Attentional modulation of delta phase and its related cascade of effects. (a,b) Color maps show CSD profiles related to standard visual (Vis) stimuli in the attend visual (AV) and attend auditory (AA) conditions for the −800 to +400 ms time frame from a representative experiment. Red arrow indicates the visual event used as a trigger (0 ms). Blue and red brackets indicate the time frame where adjoining auditory (Aud) and visual events occur; because stimuli are jittered the responses to prior stimuli are somewhat ‘smeared’ over time. (c) Overlay of CSD waveforms from supragranular site (S) in the AV and AA conditions. (d) (i) Time–frequency plot of the average oscillatory amplitude of the wavelet transformed single trials from the supragranular site in (A); note variations in theta (~6 Hz) and gamma (~40 Hz) amplitudes are coupled with stimulus-entrained delta phase. (ii) An overlay of the variations in time course of averaged (37–57 Hz) gamma amplitude in the AV and AA conditions. (e) Pooled (n = 24) normalized gamma amplitude and MUA differences between AV and AA conditions ([AV−AA]/AA) for the −325 to −275 and −50 to 0 ms time frames. Notches in the boxes depict a 95% confidence interval about the median of each distribution.

