
Fig. 1.
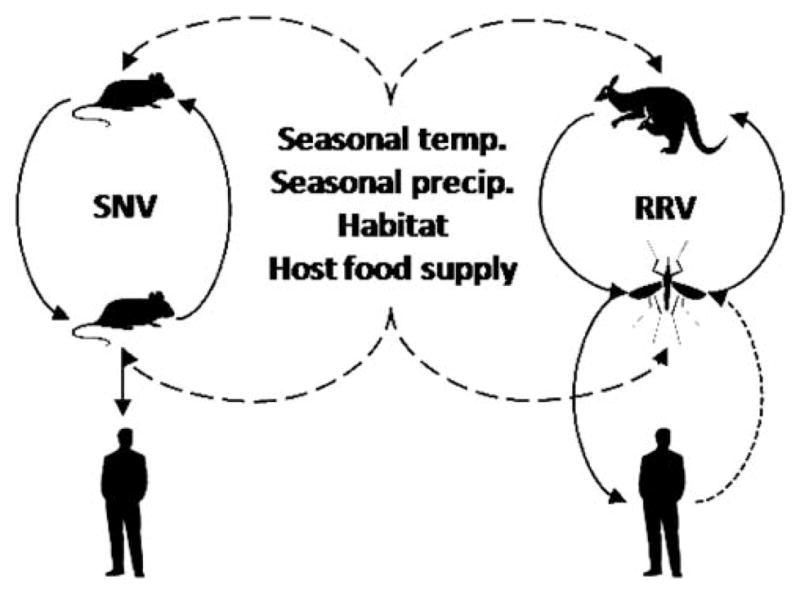
Conceptual diagram outlining aspects of the ecology and epidemiology of zoonoses that may be targeted for monitoring. Diagram represents one directly transmitted zoonosis (left, Sin Nombre virus, with rodent reservoir) and one vector-borne zoonosis (right, Ross River virus, with Macropod host and mosquito vector). Important candidate environmental variables identified that affect host and vector abundance (influence represented by long-dashed lines). Pathogen transmission represented by solid lines, except human to vector transmission (dotted line), which usually has a limited contribution to transmission.