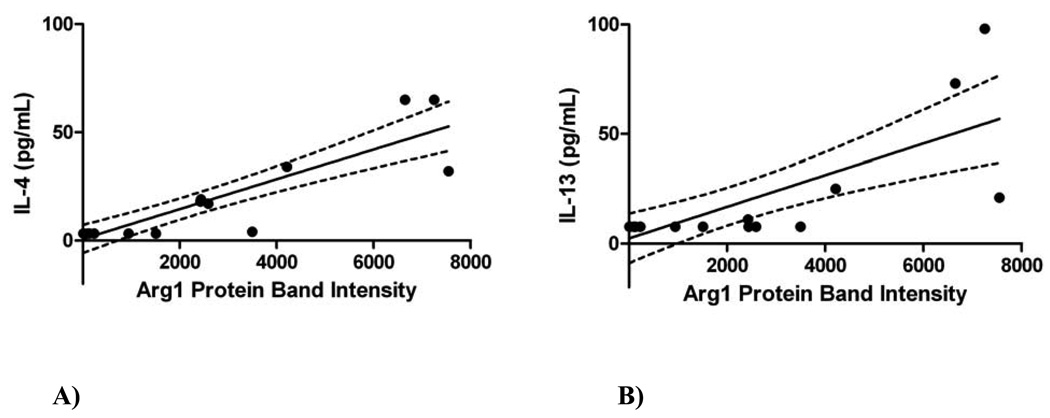
Figure 5. Correlations between Th2 Cytokines and Arginase-1 (Arg1) protein expression.
Arg1 protein expression is represented by protein band intensity (equivalent to RLU) as measured by Western blots of whole lung homogenates. The dotted lines above and below the best fit line represent the 95% confidence interval. Each dot represents one mouse.
A) The whole lung lavage IL-4 levels correlated positively with increased Arg1 protein expression in whole lung (r2=0.78, p<0.0001).
B) The whole lung lavage IL-13 levels correlated positively with increased Arg1 protein expression in whole lung (r2=0.56, p=0.0003).

