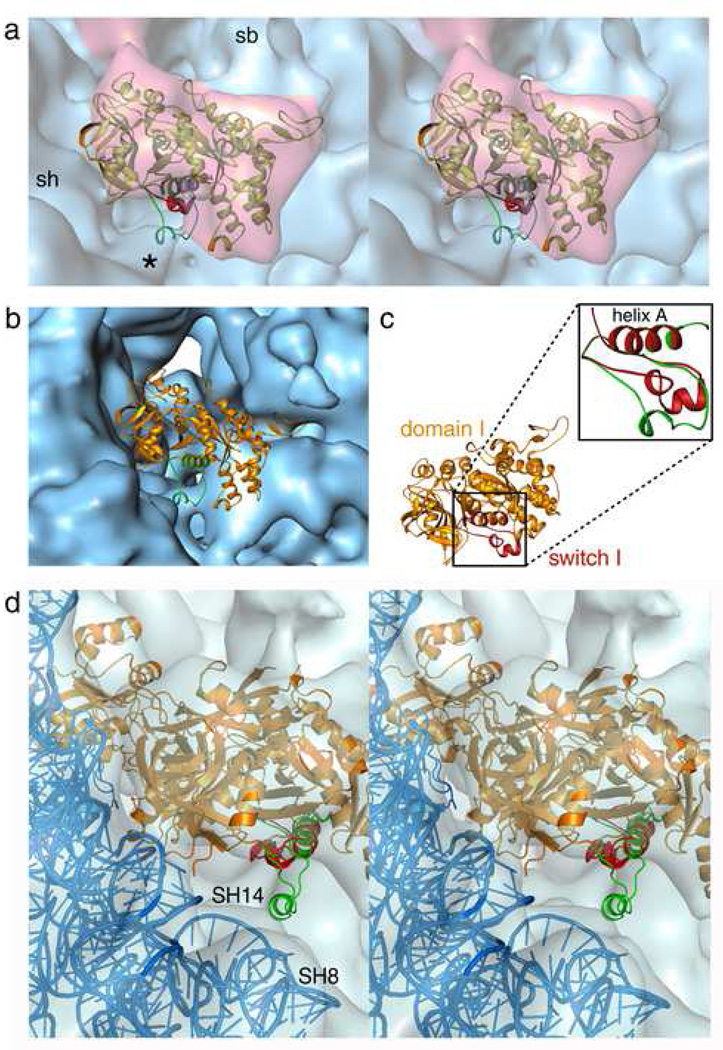
Figure 2. Conformational changes in the Switch I region.
(a) Stereo view of the domain I (G, G’) model (golden) fitted into the density attributed to eEF2 (semi-transparent red) in the AlF4 complex. The switch I structure in the GTP-form (red), and transition state model (green), clearly shows that the GTP-form is not fitted into the density, whereas extra density (marked with asterisks (*) corresponding to the short helical structure of the transition state model is visible at the shoulder region of the 40S subunit. (b) The same model of domain I docked onto the entrance of the intersubunit space of the control (empty) Tlan80S map to show that the extra density marked with asterisk in panel (a) in AlF4 complex is not associated with the control map. (c) Alignment of the switch I model in GTP-form (red) with the helix A of eEF2 domain I (golden). Inset: close-up view of the aligned models of switch I in GTP-form (red), and in transition state (green). (d) Stereo view of the eEF2 (orange), and the 40S model (blue) coordinates (pdb code: 1S1H) fitted into the sordarin post-complex map (semi-transparent blue 8). The switch I structure in GTP-form (red), and transition state model (green), both aligned to the domain I (helix A), clearly show that neither the GTP-form nor the transition state model fits into the density, and no extra density corresponding to the short helical structure of the transition state model is visible at the shoulder region of the 40S subunit.

