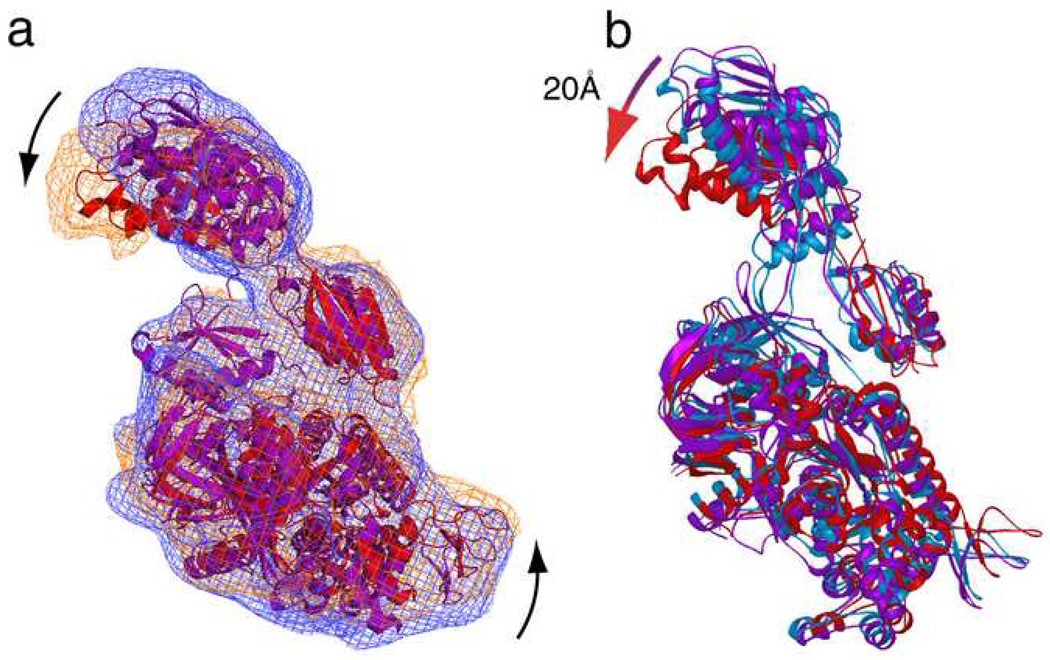
Figure 5. Comparison of eEF2 conformations in AlF4, GDPNP and sordarin complexes.
(a) Isolated densities and corresponding fitted models of eEF2 for GDPNP (Taylor et al 2007) (density, blue mesh; model, purple) and AlF4 (density, orange mesh; fitted model, red) complexes. Positional displacements of G’ and tip of domain IV are marked with arrows. (b) The eEF2 models for the GDPNP (purple), Sordarin (blue), and AlF4 (red) complexes are superimposed.

