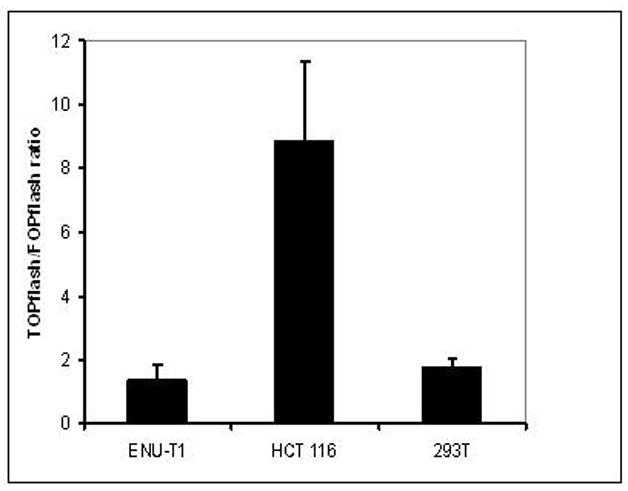
Figure 2. TOPflash/FOPflash ratio.

Expression ratio of the N-ethylnitrosourea generated ENU-T1 cell line after transfection with reporter plasmids pTOPflash and pFOPflash to examine the activation grade of wnt-signalling pathway in these cells. HCT116 cell line with activated wnt-signalling shows a nearly nine fold higher TOPflash tah FOPflash activity (TOP/FOP ratio 8,86; σ = 2,46). 293 T cells are presenting themselves with low activated wnt signalling pathway (TOP/FOP ratio 1,79; σ = 0,25). ENU-T1 cells are showing low, but not significant activation (TOP/FOP ratio 1,38; σ = 0,47).
