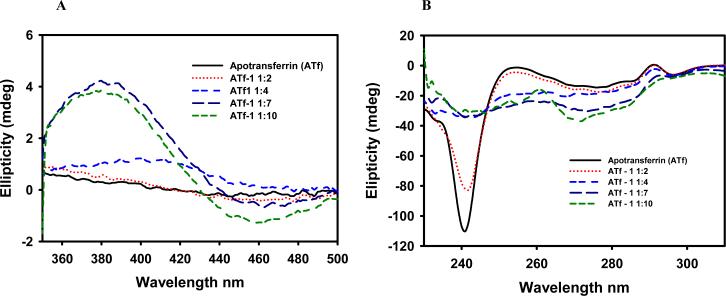
Fig. 6.
Visible region of the CD spectrum of apotransferrin incubated with complex 1. Bands associated with d-d transitions are observed after 2, 4, 7 and 10 eq of the drug (A). Aromatic region of the CD spectrum of apotransferrin after incubation with 2, 4, 7 and 10 eq of complex 1 (B). After a 10-fold excess of metal complex was added, the transferrin did not seem to be saturated. Assuming that a high percentage of the drug added binds to the protein, this observation suggests that the Ru(II)-CQ compounds bind at more binding sites than the two specific ones for iron(III).

