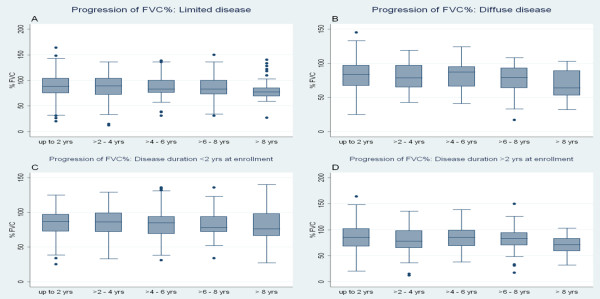
Figure 2.
Progression of percentage predicted forced vital capacity. Percentage predicted forced vital capacity (FVC%) progression in (a) patients with limited cutaneous involvement, (b) patients with diffuse cutaneous involvement, (c) patients with disease duration at enrollment <2 years, and (d) patients with disease duration at enrollment >2 years. Data are shown as box-and-whisker plots; for more details, see Figure 1.

