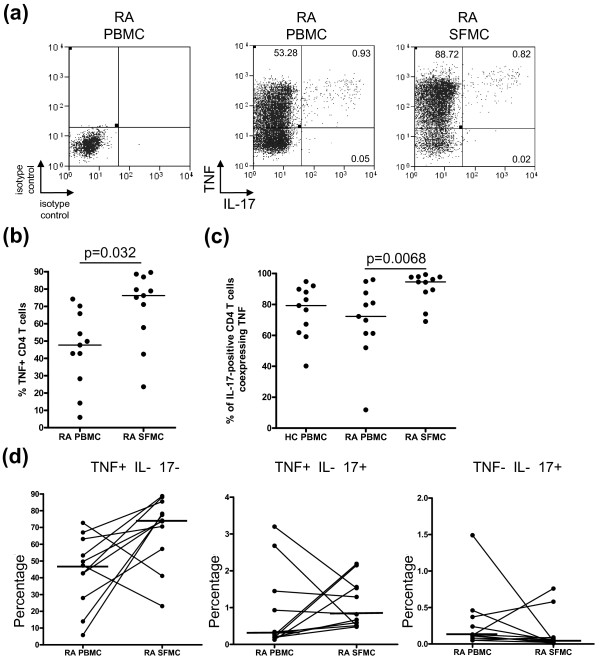
Figure 4.
Coexpression of TNFα by IL-17-producing CD4 T cells in PBMC and SFMC of patients with RA. A) Representative plots of the expression of TNFα against IL-17 in CD4 T cells from isolated PBMC and SFMC are shown. B) The percentages TNFα-positive CD4 T cells in PBMC (n = 11) and SFMC (n = 11) of RA patients. C) The percentages of IL-17-positive CD4 T cells coexpressing TNFα in PBMC from healthy donors (n = 11), paired RA PBMC and SFMC samples (n = 11) are shown. D) The frequencies of TNFα-positive IL-17-negative, TNFα-positive IL-17-positive, TNFα-negative IL-17-positive gated on CD4 T cells in RA PBMC and SFMC are shown. Bars representing the median are shown within the dot plot. The results of statistical analysis are shown within the plots. P-values less than 0.05 were considered significant.

