Figure 8.


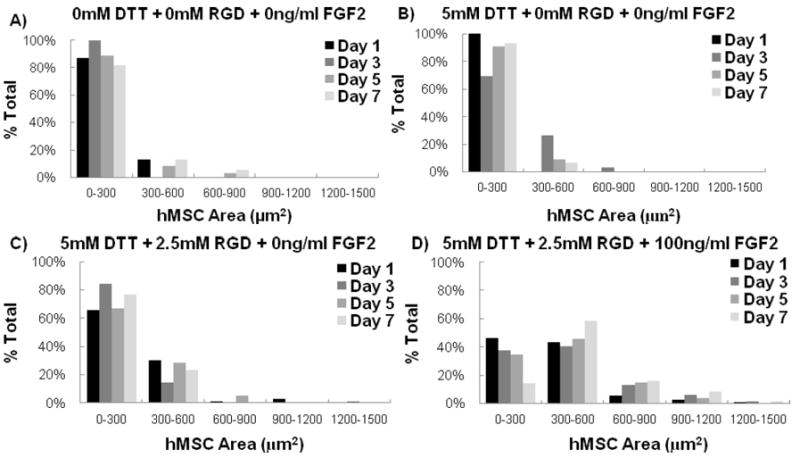
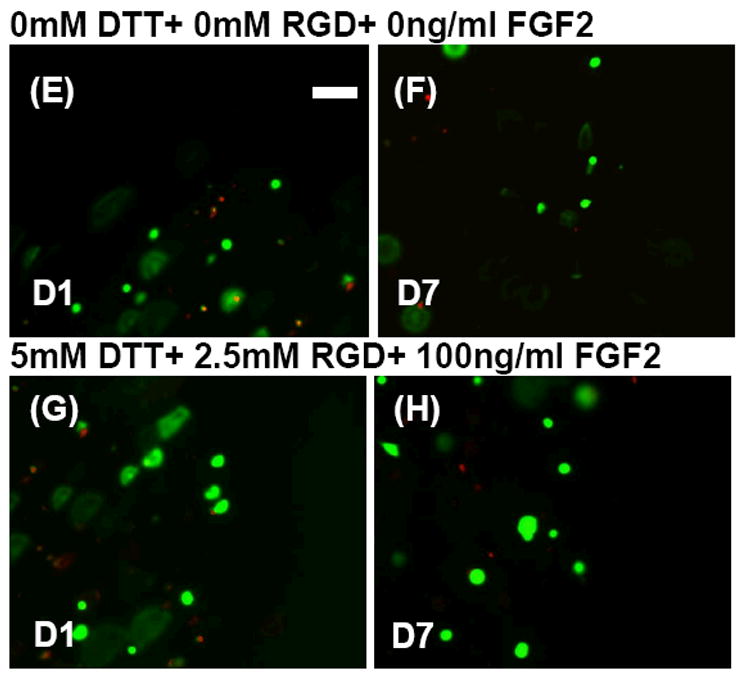
The relative frequency of hMSCs within specified ranges of projected cell area. Data are presented for hMSCs grown in array spots with A) 0mM DTT+0mM RGD+ 0ng/ml FGF2 B)5mM DTT+ 0mM RGD+ 0ng/ml FGF2 C) 5mM DTT+2.5mM RGD+ 0ng/ml FGF2 and D) 5mM DTT+ 2.5mM RGD+ 100ng/ml FGF2. Representative live/dead images of hMSC cell areas in array spots containing 0mM DTT+ 0mM RGD+ 0ng/ml FGF2 E) 1 day and F) 7 days post encapsulation. Also included are representative live/dead images of hMSC cell areas in array spots containing 5mM DTT+ 2.5mM RGD+ 100ng/ml FGF2 G) 1 day and H) 7 days post encapsulation.
