
Figure 3. H2AX Regulates SCR.
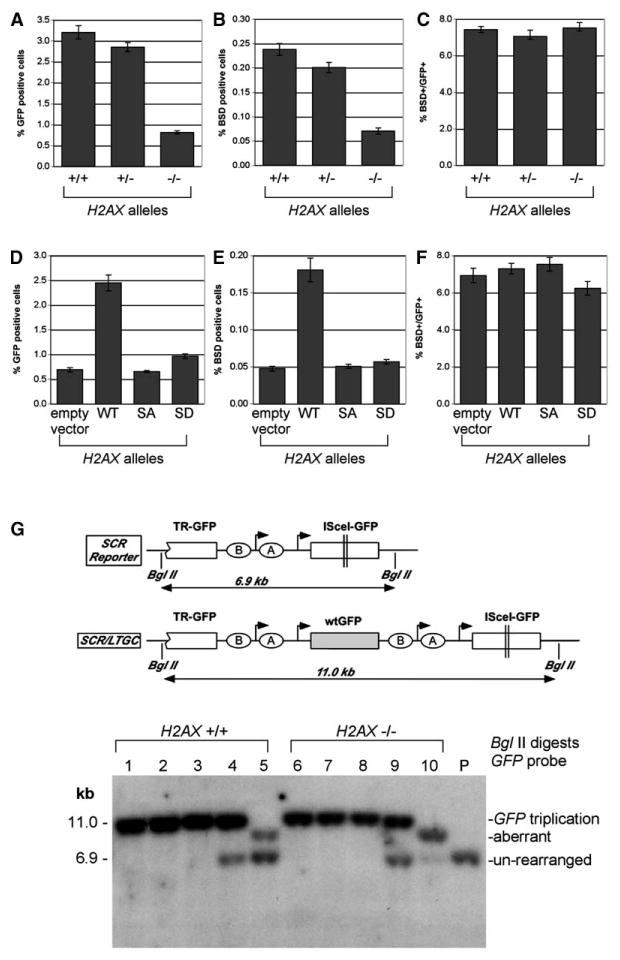
(A and D) I-SceI-induced GFP+ frequencies in ES cell lines containing the SCR reporter (A) or H2AX−/− ES cell lines containing the SCR reporter, stably reconstituted with H2AX alleles (D). These figures reproduce the data shown in Figures 1D and 2B. Bars represent mean of four independent experiments, each with triplicates. Error bars indicate SEM.
(B and E) I-SceI-induced BsdR+ frequencies in ES cell lines in the same experiments depicted in (A) and (D). Bars represent mean of four independent experiments, each with triplicates. Error bars indicate SEM. Paired t test between H2AX−/− cells and others in (B), p < 0.001%. Paired t test between wt and any other samples in (D), p < 0.001%. Frequency of spontaneously arising BsdR+ cells was ∼0.001% in all cases and is not shown.
(C and F) Ratios of I-SceI-induced BsdR+ to GFP+ frequency from the same experiments shown in (A) and (B) or (D) and (E). Bars represent mean of ratios in four independent experiments, each with triplicates. Error bars indicate SEM. All differences, not significant. (G) Southern blot analysis of I-SceI-induced BsdR+ colonies (BglII digests of gDNA, GFP probe). Cartoon shows schematic of unre-arranged reporter and of GFP triplication outcome. Lanes 1–3 and 6–8 are representative of GFP triplication events (H2AX status as indicated). Lanes 4 and 9 are representative of mixed clones with GFP triplication and parental reporter (compare Puget et al., 2004). Lanes 5 and 10 are representative of aberrant SCR/LTGC events. P, parental (unrearranged) reporter.