Fig. 2.
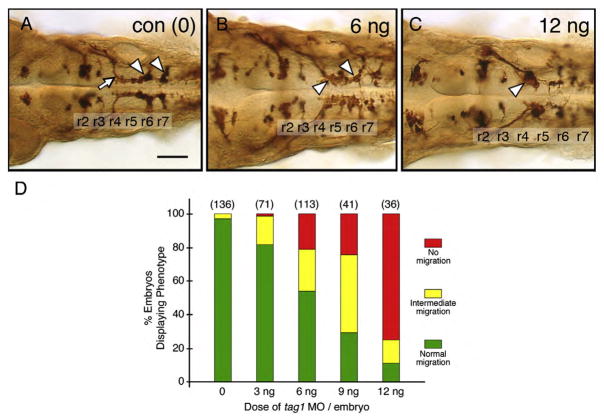
FBMN migration is affected in tag1 morphants. Top panels show dorsal views of the hindbrain with anterior to the left. FBMN cell bodies and axons were visualized in Tg(isl1:gfp) embryos using anti-GFP antibody. (A) In a 36 hpf control (uninjected) embryo, FBMNs (arrowheads) migrate normally into r6 and r7. (B) An embryo injected with a suboptimal dose (6 ng) of tag1 MO exhibits an intermediate phenotype, with many FBMNs (arrowheads) remaining in r4 and others migrating into r6 and r7. (C) In an embryo injected with an optimum dose (12 ng), most FBMNs (arrowhead) fail to migrate tangentially out of r4, but many appear to be displaced into r5. (D) Quantification of the tag1 MO dose–response effect. The green, yellow, and red phenotypic classes correspond to the FBMN migration patterns depicted in panels A–C, respectively. Data from 2–3 experiments; number in parenthesis denotes number of embryos. Scale bar in A (75 μm for A–C).

