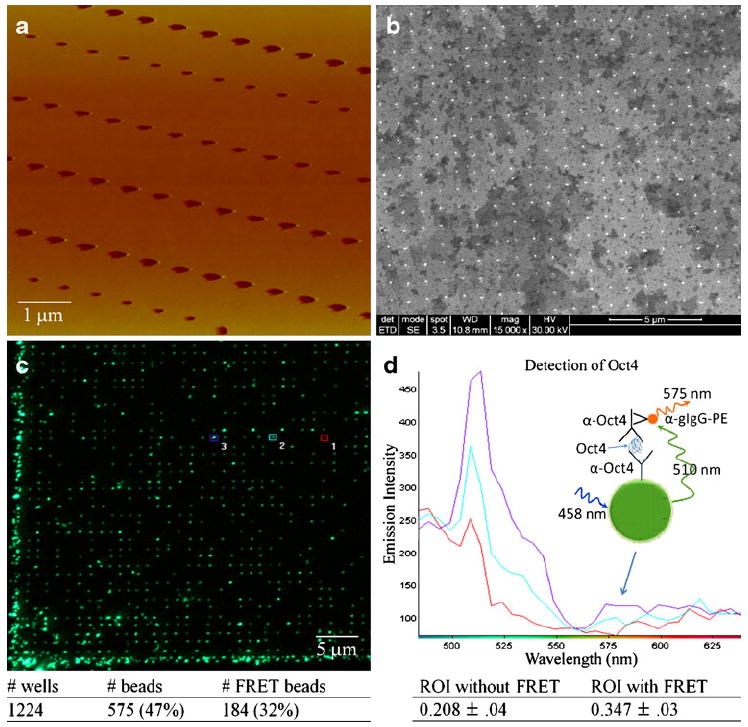
Fig. 4.

High-density one-component protein nanoarray. a The AFM image of the patterned wells capable of making nanoscale protein array. Each well is separated by 1 μm (center-to-center). The smallest well is about 100 nm (to accommodate 80 nm beads). b High-density nanoarray containing 100 nm beads. Each bead is separated by 1 μm (center-to-center). c Spectral image of 100-nm green beads. The image is digitally zoomed by the confocal microscope illustrating some FRET signals. The table below the image summarizes the number of beads involved. d Raw spectrums collected from three spots in c. The table shows that the spots with FRET have higher ratio of intensity (ROI; 575 nm/510 nm) than the spots without FRET (p<0.05). The average ROI is evaluated from all applicable beads, not just three places. The inset image demonstrates the possible pathway from exciting the donor to emitting FRET from the acceptor
