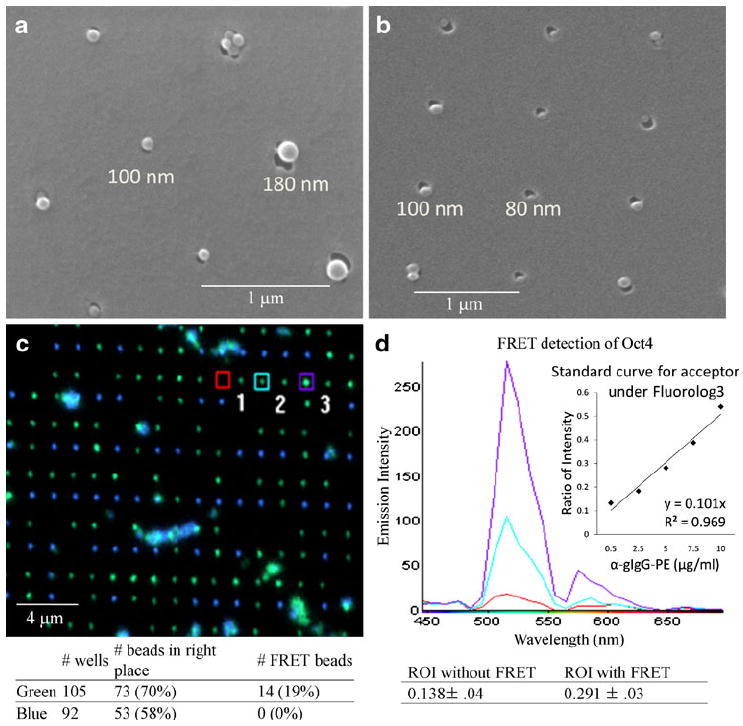
Fig. 5.

Multi-component SDSA protein nanoarray for the detection of Oct4. a SEM image of 180 and 100 nm beads bound to their corresponding wells size. b SEM image of 100 and 80 nm beads nanoarray. c Spectral image of 180-nm blue mIgG-conjugated beads and 100-nm green anti-Oct4 conjugated beads. The table below the image summarizes the number of beads involved. d Raw spectrums collected from three locations in c, illustrating the detection of Oct4 through FRET signals. The inset graph shows the linear relationship between the concentration of F(ab)2 fragment of anti-gIgG-PE and the ROI (575 nm/510 nm). The average ROI is evaluated from all applicable beads, not just three places. This relationship is then correlated with the ROI from each spot on the confocal spectrum image to determine the detection limit
