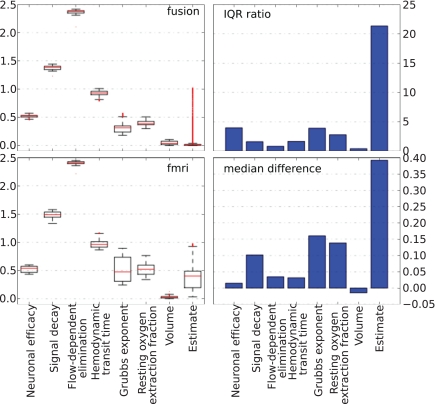
Figure 10.
Non-parametric summary of parameter behavior by box and whisker (1. 5 IQR) and bar-plots comparing all parameters optimized by the PF on simulated data using fMRI-only vs. fusion data. These include seven hemodynamic parameters (Θ and V0) and the estimate of neural activity. Bar-plots on the right summarize two important differences between results produced using fMRI-only and fusion data: ratio of IQR of fMRI over fusion, and difference of fMRI and fusion medians.

