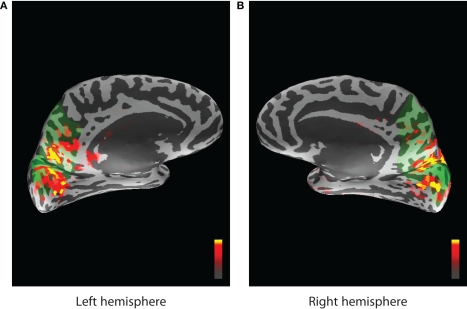
Figure 12.
Activity localized by the MNE software inverse solution and overlayed on the inflated cortical surface. Peak stimulus driven activity is shown by red and yellow colors. Green areas indicate the region selected from the FreeSurfer atlas and corresponding to cuneus, precuneus, and pericalcarine ROIs for the left (A) and the right (B) hemispheres.

