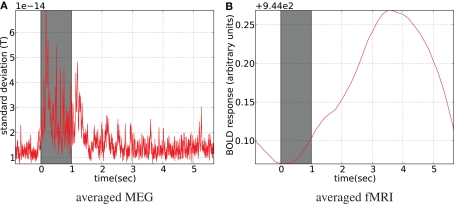
Figure 13.
Stimulus-locked averaged data. Stimulus presentation is shown with the gray bar from 0 to 1 s, where 8 Hz flashing checkerboard was presented. fMRI was linearly interpolated to MEG sampling rate (1200 Hz) before averaging (A). For MEG spatial standard deviation in the sensor space is shown (B), (the global field power).

