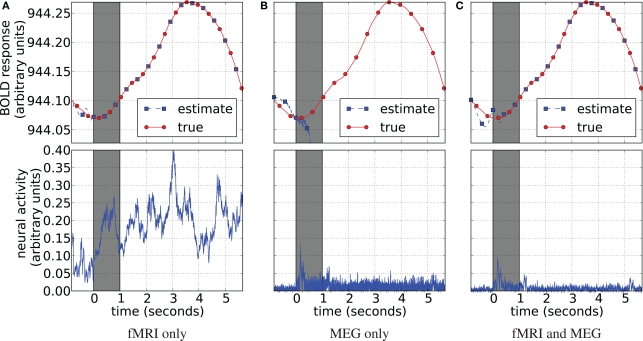
Figure 14.
Blood oxygenation level dependent (top) and neural activity (bottom) estimation plots. Each plot displays the averaged BOLD response (red circles) plotted with the corresponding signal estimate produced by our Bayesian sensor fusion model (blue squares). Since true neural activity is not known for the real dataset only the estimate is displayed in the bottom plots. Horizontal axes give time (seconds), while vertical axes are arbitrary units for signal response. The BOLD response is perfectly tracked by fMRI (A) as well as by the joint analysis (C). However, MEG completely fails to track it. fMRI-only analysis fails to track neural response (B). In both cases this is due to varying parameters of the HFM, required since the true parameters are unknown. This lead to underdetermined problem in case of fMRI, creating random results while maintaining perfect fit, and also allowed the MEG-only case to drift off completely, since it was not constrained by the BOLD response. The joint analysis is closely tracking the BOLD response and provides neural activity estimation consistent with expectation from previous knowledge about the experiment (C).

