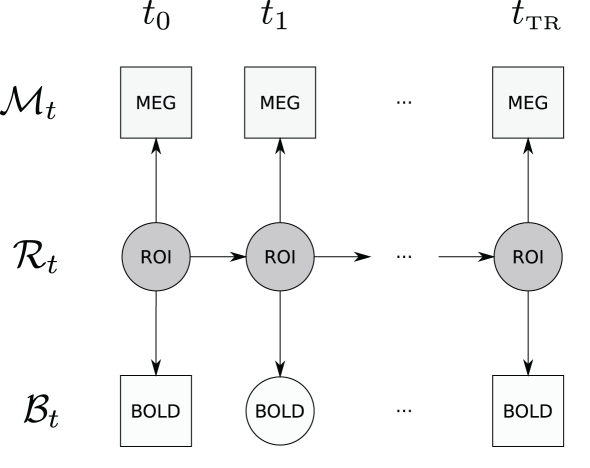
Figure 2.
Graphical structure of the DBN that is used in this paper – displayed is a window for a single TR. Observations are denoted by squares (MEG and BOLD); hidden variables are denoted by circles (neural activity in an ROI and unobserved BOLD time points); arrows denote transition and observation models. Due to the sampling frequency difference, many MEG observations are available per single fMRI TR. Time between ti and ti+1 corresponds to the MEG sampling time period.

