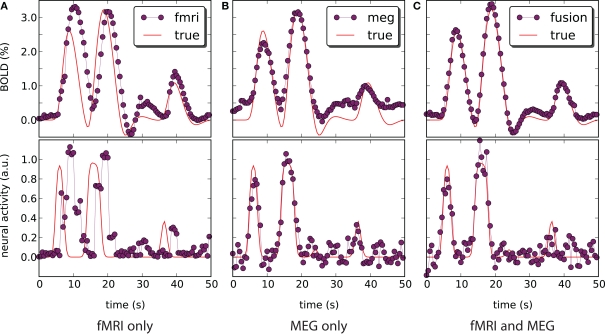
Figure 5.
Blood oxygenation level dependent (top) and neural activity (bottom) signal plots. Each plot displays the ground truth signal (lines) plotted with the corresponding signal estimate produced by our Bayesian sensor fusion model (circles). Horizontal axes give time (seconds), while vertical axes are arbitrary units for neural activity and percent of change relative to baseline for BOLD. When the estimated curve falls close to the true curve, the model is performing well. (A) Displays estimation using only fMRI signal data; (B) displays estimation from only the MEG signal; while (C) shows the result of fusing both channels of data into a single estimate. We see that the fusion approach matches both the BOLD response and the neural activity more closely than do either of the single-channel estimates. Specifically, the fusion estimate tracks the BOLD response better than MEG and resolves a temporal ambiguity in the fMRI-only estimate. The temporal ambiguity corresponds to the hemodynamic delay, which is present as a parameter in our model. In (A,C) we have deliberately set the delay parameter to 0 to demonstrate that the fusion approach can use the MEG channel to resolve the hemodynamic delay without relying on a manually set parameter.

