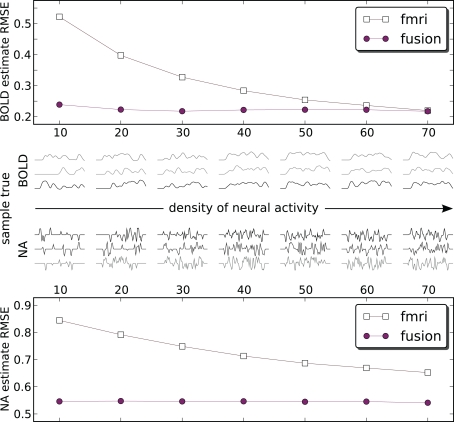
Figure 8.
Estimation RMS error for BOLD (top) and neural activity (bottom) signals. Each point on the plot is an average of 1000 simulations each with its own ground truth. Neural activity becomes denser from left to right. To provide an idea what the signals look like the central panel shows a random sample of three true input and output signals 50 s in duration for each density. Data is available only at the markers (circles: fusion, squares: fMRI) – lines are for visual guides only. Estimates of both methods are compared to the absolute value of neural activity. fMRI estimates are shifted by the out of sequence parameter of −3 s to remove the harmful effect of incorrectly identified delay (Figure 5A).

